Creating Kibana Visualizations with Bike Share Data
I’ve been working with Elastic for a few years now, and one of the most underappreciated features of Elastic is Kibana as a visualization tool. Lots of people think of Elastic as a logging stack (probably because most of the focus has been ELK or Beats) and Log Data is a great use of Elastic, but Elastic is a really good tool for data discovery of any sort – not just APM or Software logs.
In this walkthrough, we will:
- Download public bike trip data and create an index mapping
- Download and run the RocDevESLoader tool
- Create and use a Kibana index pattern
- Build and save some visualizations
- Create a saved dashboard
Introduction
To follow along with this tutorial, you’ll need a few things:
- A REST API tool such as Postman
- An Elastic cluster (or standalone server) running Elastic 7.6+ Basic (Not Apache2 or ODFE) with Kibana attached.
- The ability to build/run a C# application (You can use Visual Studio Community Edition if you’d like)
- I like to use Git BASH on Windows
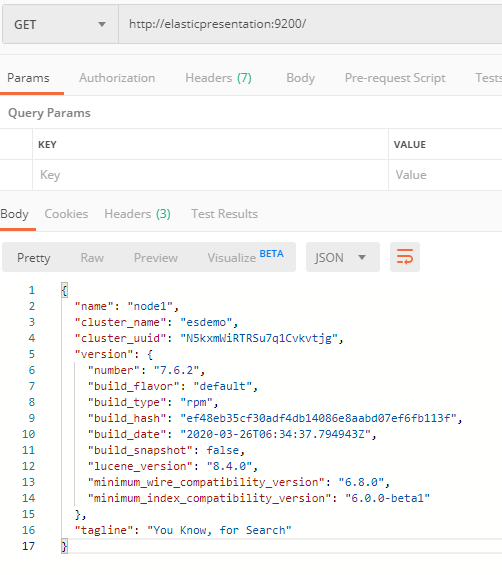
If you use Postman to go to your Elastic URL, it should look something like this:

Just to give some hardware context, I’ll be running this ES Cluster (and Kibana) as RPM packages on a VM that has:
- 4 CPU Cores (2.6GHz)
- 16GB of RAM
- 512GB SSD
This level of hardware isn’t out of reach if you’re just making a VM or running a docker from your laptop.
Once you’re there, let’s move on to Downloading Public Bike Trip Data.